Artists Popularity Model
Project
The goal of Chicago Music Compass is to help users discover Music Events in Chicago. This is accomplished by aggregating information about events and artists in the city.
To enhance this project, I aimed to develop a machine learning model using TensorFlow to assess an artist's popularity.
Fortunately, I stumbled upon MusicOSet, a dataset containing nearly 4000 entries of renowned artists. Among their data, they provide a metric for Popularity. This dataset can serve as a valuable resource for our project.
Hypothesis
The hypothesis suggests that there could be a correlation between the number of Twitter followers an artist has and their overall popularity.
X = Twitter Followers
Y = Popularity
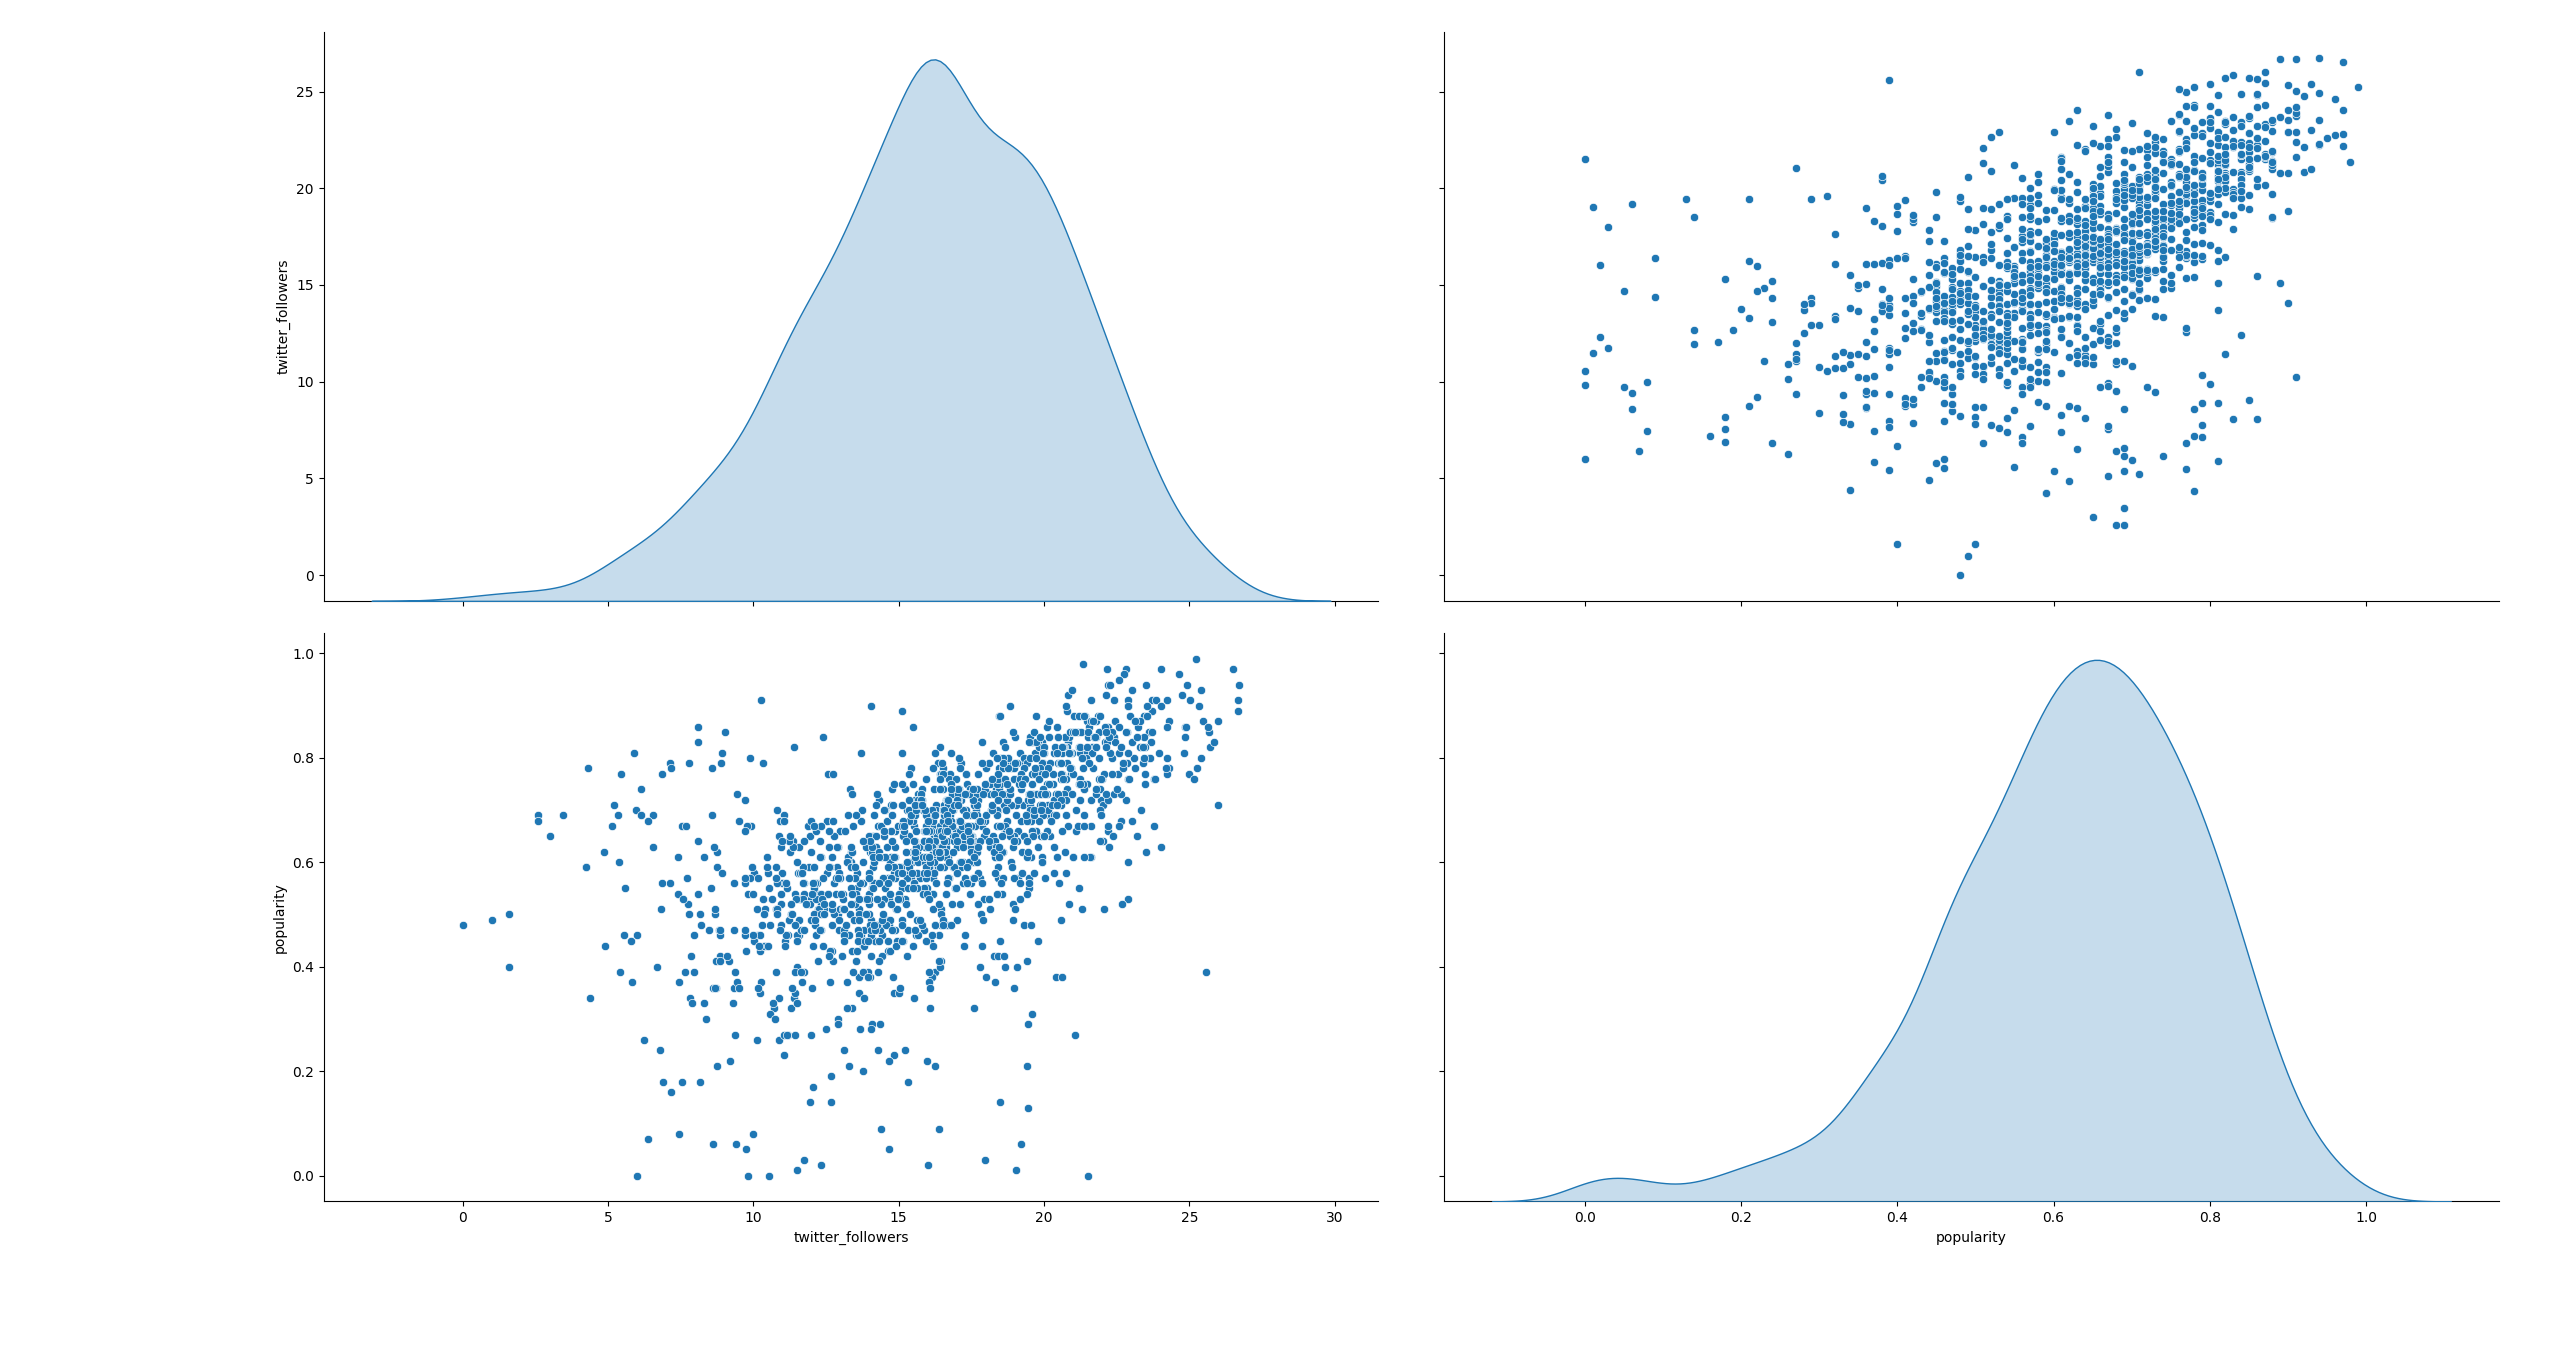 Image 1. Twitter Followers vs Popularity.
Image 1 depicts a discernible correlation with some scattered noise. The chart exhibits a diagonal trend with outliers.
To maintain simplicity, I am currently focusing on a single attribute, making this scenario suitable for a regression model.
Data
The records retrieved from MusicOSet lack Twitter follower data. However, the project has the capability to acquire this information. After incorporating this value, approximately 2000 records were obtained.
Here's a glimpse of the data structure:
dataset.tail()

twitter_followers, popularity
71787, 46
4382, 55
7497, 59
1943, 47
3128, 58
Here the Artists Music Compass dataset.
Transformations
Since the range of Twitter followers varies significantly, spanning from 0 to several billions, I opted to employ a logarithmic scale for this value.
dataset["twitter_followers"] = np.log2(dataset["twitter_followers"])
Popularity ranges from 0 to 100. Through experimentation, I discovered that the model performs better when this value is converted to decimals.
dataset["popularity"] = dataset["popularity"] / 100
Here a description of the dataset:
train_dataset.describe().transpose()


                  mean       min   25%     50%     75%     max
twitter_followers  16.211361  0.0   13.384  16.401  19.478  26.726
popularity         0.620809   0.0   0.5200  0.6400  0.7400  0.990
Regression Model
After experimenting with the model, I identified the following configurations as the most effective in minimizing loss:
Optimize: Adam
Learning rate: 0.1
Loss: Mean Squared Error
Under these configurations only one epoch is needed.

In image 2, we can see that at epoch 1, the Test curve approaches the Train curve. If I increase the number of epochs, the Test curve surpasses the Train curve.
Here is an example with 100 epochs.

Predictions

In image 4, we observe a black line representing the prediction of random numbers, which falls within the range of the scatter points.
x = tf.linspace(0.0, np.log2(max(raw_dataset["twitter_followers"])), 1000)
y = model.predict(x)
Loss value: 0.03282
Conclusion
Although the dataset is small, it is sufficient for this exploratory round. Currently, the regression model aids in predicting the popularity of artists discovered by the project. This popularity metric is utilized to arrange the list of artists showcased on Chicago Music Compass.
The next step involves conducting a similar analysis but using a different metric, most likely Instagram followers. Stay tuned for updates.
Fun Fact
I recently discovered that Ariana Grande doesn’t have a Twitter account.
Bonus
Feel free to visit Is my Twitter popular?, to compare your twitter account with the artists. This utilizes the same regression model trained here.